Clamps Overview
Debugging Tools
Logging
To obtain information about the state of the program while it is running, Incudine implements a logging mechanism which is imported into clamps. Messages can be formatted to the REPL using the msg function. The first argument to that function is the logger level.
There are 4 available logger levels, :error, :warn, :info
and :debug in ascending order. The currently active logger level
can be returned or set using the logger-level function.
If a msg command uses a logger level <= the current logger level, it will be printed in the REPL, otherwise the msg command doesn't produce any output:
(logger-level) ; => :warn

(msg :warn "Warning") ; => nil

;; Output in the REPL:
;; warn: Warning

(msg :error "Error") ; => nil
;; Output in the REPL:
;; error: Error

(msg :info "Info") ; => nil
;; No Output in the REPL!

(setf (logger-level) :info) ; => :info
(msg :info "Info") ; => nil
;; Output in the REPL:
;; Info

(msg :error "Error") ; => nil
;; Output in the REPL:
;; error: Error
This mechanism can be used to put messaging into the code which is only activated for certain logger levels to be able to trace and inspect what is going on in the application by setting the appropriate logger level. In addition output can be directed by setting the *logger-stream* special variable.
The Sly Debugger
Common Lisp has a unique mechanism for error recovery called Condition System1. Whenever an error is encountered, emacs opens a new Buffer similar to the one shown below.
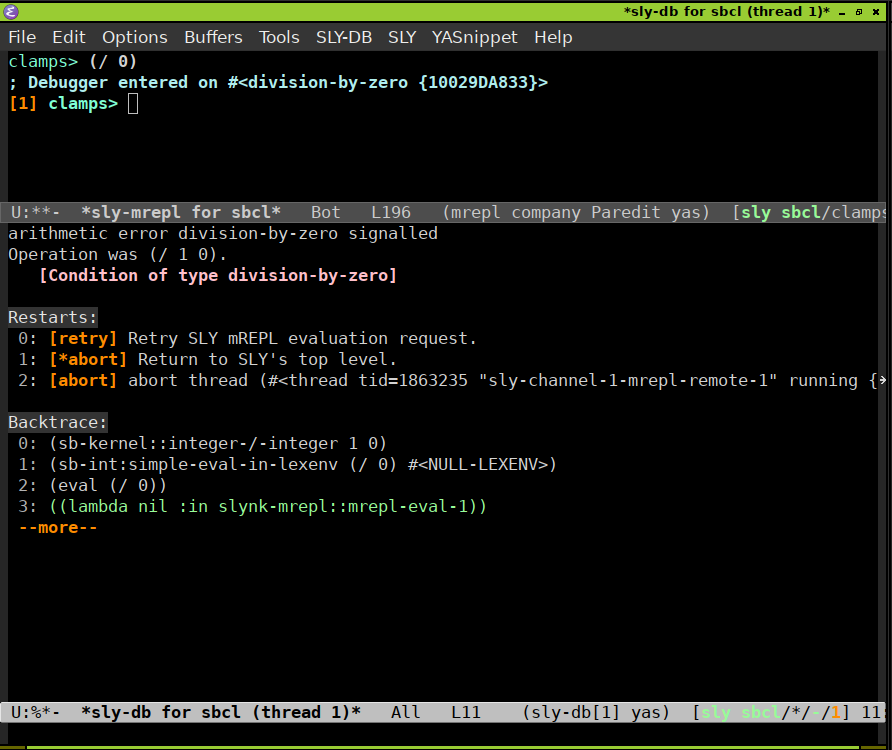
It is very important to note that even though an error just occurred, the Lisp REPL is still responsive and a user can continue to work with the system. Nevertheless, the error condition should always be handled by invoking one of the restarts, listed under Restarts: to avoid multiple threads open in the background not doing anything useful.
In the above example, restart "1" or "2" are probably the most sensitive choices as retrying to divide by zero, as restart "0" suggests, would result in the same error condition as before. The restart is selected by pressing the corresponding number key on the keyboard. Aborting the debugger thread can also get accomplished using the q key.
Studying the Backtrace can convey important information about the context and sequence of function calls causing the error condition. The Sly Debugger includes a comfortable inspector to see and inspect the arguments of all functions leading to the error.
Internet Resources
It is beyound the scope of this reference to give a detailed introduction into all debugging and inspection options in a mature Common Lisp environment like Emacs/Sly/sbcl. An excellent online collection of tools and information can be found in the Debugging chapter of the Common Lisp Cookbook. Studying it is strongly recommended.
Footnotes:
For a detailed description see the excellent Book by Michal "phoe" Herda: The Common Lisp Condition System, Beyond Exception Handling with Control Flow Mechanisms, APress 2020